I had the opportunity to attend last week’s PragmaticStudio Clojure workshop taught by Rich Hickey and Stuart Halloway (I highly recommend it, and there are still seats open for the May class). During the three days I talked with Rich about features he’d like to see in Incanter, and the first thing he asked about was adding dynamic charts, like are available in Mathematica using the Manipulate function. So I ended up spending much of my lab time working on this feature, the first draft of which is now available.
Incanter has three new macros, sliders, dynamic-xy-plot, and dynamic-scatter-plot. The sliders macro can bind multiple named sequences to an equal number of JSlider widgets. When a slider is manipulated a user defined expression is evaluated. For instance, the following code will display two slider widgets bound to two sequences, x and y.
(sliders [x (range -3 3 0.01)
          y (range 0.01 10 0.1)]
  (foo x y))
Each time one of the sliders is manipulated the expression (foo x y) will be evaluated with the new value of either x or y. Presumably, foo has side effects, like changing the value of a ref or manipulating a GUI widget, since it is running in the separate thread used by the slider widget.
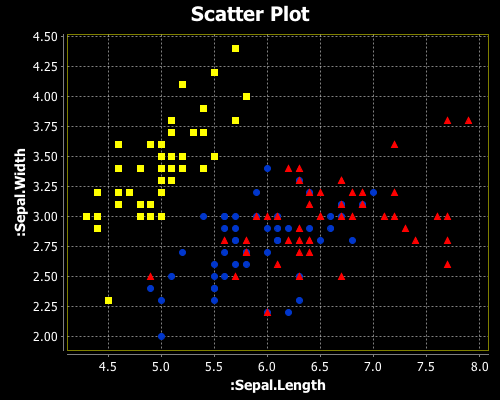
I then combined this macro with incanter.charts/set-data function to create dynamic versions of xy-plot and scatter-plot, named appropriately dynamic-xy-plot and dynamic-scatter-plot respectively.
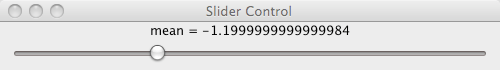
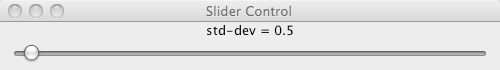
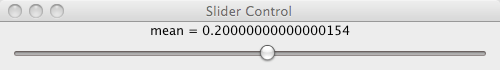
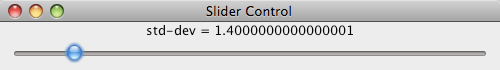
The following example creates an xy-plot of a sequence of values named x versus the normal PDF of x, and displays two sliders bound to the mean and standard deviation of the PDF.
(let [x (range -3 3 0.1)]
(view (dynamic-xy-plot [mean (range -3 3 0.1)
std-dev (range 0.1 10 0.1)]
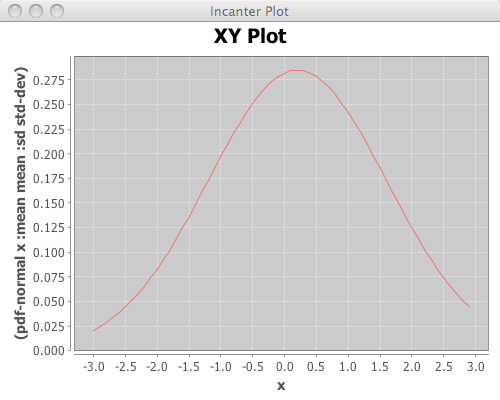
[x (pdf-normal x :mean mean :sd std-dev)])))

The expression provided to dynamic-xy-plot must produce a sequence containing either two sequences with N values, or N sequences with two values each. In other words, a N-by-2 matrix or a 2-by-N matrix, where N is the number of points plotted. The expression above,
[x (pdf-normal x :mean mean :sd std-dev)]
produces a vector containing a sequence called x and the sequence produced by calling pdf-normal on x (equivalent to a N-by-2 matrix).
Manipulating the sliders will change the shape and position of the curve.
The dynamic-scatter-plot macro works the same way as dynamic-xy-plot. All three macros are available in the version of Incanter on Github and in repo.incanter.org.