
JFreeChart has been a fantastic library, I’ve been able to include useful charting functionality in Incanter very quickly because of it, but I’m not a big fan of its default visual theme. Eventually I’d like to create some new themes, or better yet include themes created by others, but in the meantime I have created the set-theme function, which accepts a chart and either a keyword indicating a built-in theme or a JFreeChart ChartTheme object, and applies the theme to the chart.
At the moment, the only built-in themes are :default and :dark, but hopefully that will change in the future.
Here’s an example of using set-theme. First I’ll create a chart with the default theme,
(use '(incanter core charts datasets))

(with-data (get-dataset :iris)
  (view (scatter-plot :Sepal.Length :Sepal.Width :group-by :Species)))

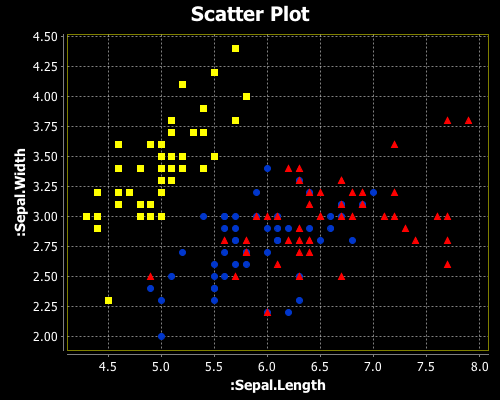
and here’s the same scatter-plot with the dark theme.
(with-data (get-dataset :iris)
  (doto (scatter-plot :Sepal.Length :Sepal.Width :group-by :Species)
    (set-theme :dark)
    view))
The set-theme function is available in the latest version Incanter @ Github.
I have also added the incanter-pdf module discussed in the previous blog post, but it isn’t installed by default. To install it in your local Maven repository, run ‘mvn install’ from the incanter/modules/incanter-pdf directory.

I noticed that the default theme in PNG looks almost indistinguishable when printed. How can we do a boring-est black/grey on white?
Funny you should ask, I’m looking into that right now. Amazingly, it seems difficult to render without color.
Right now I’m working on eliminating the drop shadow and gradients from histograms (I really hate those).
You can get a white background on a chart with the clear-background function.