
Permutation tests can be used with many different statistics, including correlation.
For this example, you will need the incanter.core, incanter.stats, incanter.charts, and incanter.datasets libraries. The incanter.datasets library contains sample data sets.
Load the necessary Incanter libraries.
(use '(incanter core stats charts datasets))For more information on using these packages, see the matrices, datasets, and sample plots pages on the Incanter wiki.
Load the us-arrests data set:
(def data (to-matrix (get-dataset :us-arrests)))Now extract the assault and urban population columns:
(def assault (sel data :cols 2))
(def urban-pop (sel data :cols 3))
Calculate the correlation between assaults and urban-pop:
(correlation assault urban-pop)The sample correlation is 0.259, but is this value statistically significantly different from zero? To answer that, we will perform a permutation test by creating 5000 permuted samples of the two variables and then calculate the correlation between them for each sample. These 5000 values represent the distribution of correlations when the null hypothesis is true (i.e. the two variables are not correlated). We can then compare the original sample correlation with this distribution to determine if the value is too extreme to be explained by null hypothesis.
Start by generating 5000 samples of permuted values for each variable:
(def permuted-assault (sample-permutations 5000 assault))
(def permuted-urban-pop (sample-permutations 5000 urban-pop))
Now calculate the correlation between the two variables in each sample:
(def permuted-corrs (map correlation
                         permuted-assault
                         permuted-urban-pop))
View a histogram of the correlations
(view (histogram permuted-corrs))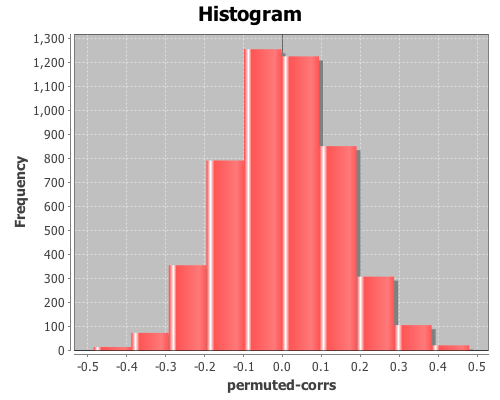
And check out the mean, standard deviation, and a 95% interval for the null distribution:
(mean permuted-corrs)The mean is near zero, -0.001,
(sd permuted-corrs)the standard deviation is 0.14,
(quantile permuted-corrs :probs [0.025 0.975])and the values returned by the quantile function are (-0.278 0.289), which means the original sample correlation of 0.259 is within the 95% interval of the null distribution, so the correlation is not statistically significant at an alpha level of 0.05.
The complete code for this example is found here.
Further Reading
- Correlation (Wikipedia)
- Permutation tests (Wikipedia)
