
In a previous post, Dynamic charts with Incanter, I demonstrated how sliders can be linked to either an xy-plot or a scatter-plot. In this post I’ll demonstrate how sliders can be used to manipulate a dataset query, and dynamically update the results in a table.
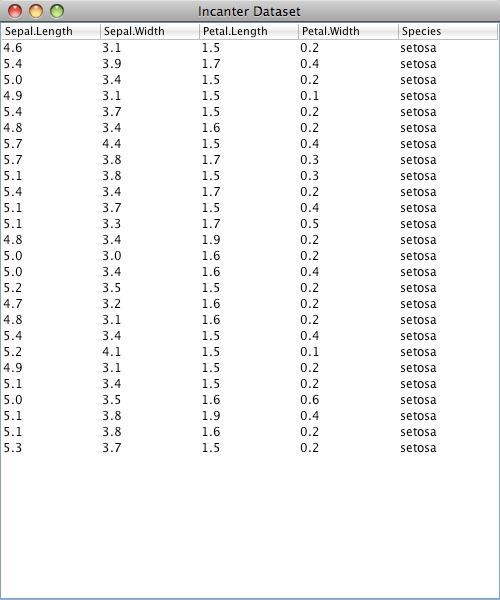
Start by using the get-dataset function to load the iris sample data. Next, create a Swing JTable object containing the data with the data-table function, and then view it.
(use '(incanter core charts datasets))

(let [data (get-dataset :iris)
      table (data-table data)]
  (view table)
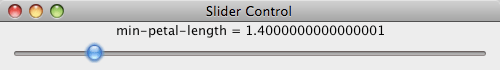
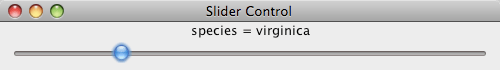
Use the sliders macro to create two sliders; one bound to species, a vector of iris species values, and the other bound to min-petal-length, a range of petal-lengths that will provide the lower bound for a query, and then create the expression that will be evaluated when the sliders are manipulated.
  (sliders [species ["setosa" "virginica" "versicolor"]
            min-petal-length (range 0 8 0.1)]
    (set-data table ($where {:Species species
                             :Petal.Length {:gt min-petal-length}}
                            data))))
In this case, the expression uses the set-data multi-method to update the values of the data-table with the results from a $where query.
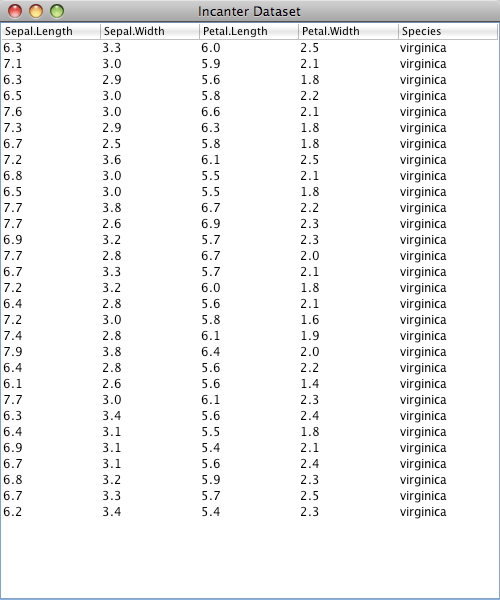
Manipulating the sliders changes the query values, and dynamically updates the rows in the table.

Although it would be more natural to use a drop-down option menu, check-boxes, or radio-buttons to manipulate the species values, this example demonstrates that non-numeric values can be bound to sliders.

The data-table function and set-data multi-method are available in the latest version of Incanter on Github and on repo.incanter.org.
