
This example will demonstrate the use of the chisq-test function to perform tests of independence on a couple sample data sets.
The first data set shows the number of male and female students with each of 16 different combinations of hair and eye color. We will use this data sample to test whether there is an association between hair and eye color. We will test males and females separately.
First load the necessary libraries.
(use '(incanter core stats charts datasets))Now load the sample data with the get-dataset function, and then use group-by to break the data set into two groups based on gender (third column).
(def by-gender (group-by (get-dataset :hair-eye-color) 2))Now take a look at the data for the males,
(def male-data (first by-gender))
(view male-data)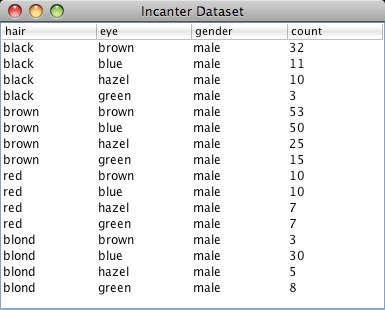
and the females.
(def female-data (second by-gender))
(view female-data)
Extract the hair color, eye color, and count values from the data set, defining three new variables.
(def m-hair (sel male-data :cols 0))
(def m-eye (sel male-data :cols 1))
(def m-count (sel male-data :cols 3))
Now use the bar-chart function to show the distribution of hair and eye color for males,
(view (bar-chart m-hair m-count
                 :group-by m-eye
                 :legend true
                 :title "Male Hair and Eye Color"
                 :x-label "Hair Color"
                 :y-label "Number of males"))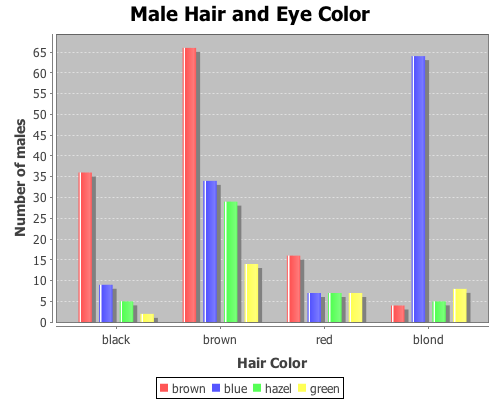
and for the females.
(def f-hair (sel female-data :cols 0))
(def f-eye (sel female-data :cols 1))
(def f-count (sel female-data :cols 3))
(view (bar-chart f-hair f-count
:group-by f-eye
:legend true
:title "Female Hair and Eye Color"
:x-label "Hair Color"
:y-label "Number of females"))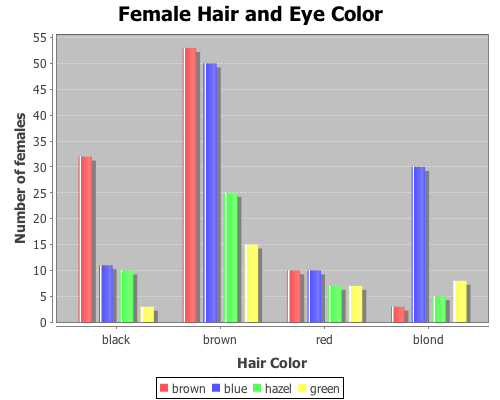
We can reshape the two vectors of 16 count values (male and female) into two 4×4 contingency tables using the matrix function.
(def m-table (matrix m-count 4))
(def f-table (matrix f-count 4))
Here are the two new contingency tables.
> m-table
[36.0000  9.0000  5.0000  2.0000
 66.0000 34.0000 29.0000 14.0000
 16.0000  7.0000  7.0000  7.0000
 4.0000 64.0000  5.0000  8.0000]

> f-table
[32.0000 11.0000 10.0000  3.0000
 53.0000 50.0000 25.0000 15.0000
 10.0000 10.0000  7.0000  7.0000
 3.0000 30.0000  5.0000  8.0000]
Now run the chisq-test function on the two tables,
(def m-test (chisq-test :table m-table))
(def f-test (chisq-test :table f-table))
and view the X-sq test statistics, the degrees of freedom, and the p-value for the test for males,
(:X-sq m-test) ;; 106.66
(:p-value m-test) ;; 7.01E-19
(:df m-test) ;; 9
and females.
(:X-sq f-test) ;; 41.28
(:p-value f-test) ;; 4.45E-6
(:df f-test) ;; 9
Both p-values are considerable below a 0.05 cut off threshold, indicating that the null hypothesis, that there is no association between eye and hair color, should be rejected for both males and females.
In addition to passing contingency tables as arguments to chisq-test, you can pass raw data using the :x and :y arguments, which we will do in the following example.
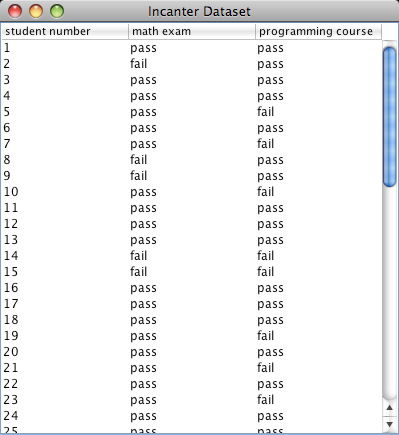
This example will test whether there is any correlation between the pass/fail results of a high school mathematics proficiency test and a freshman college programming course. The math-prog data set includes three columns: student_id, high school math proficiency test pass/fail results, and freshman college programming course pass/fail results.
First load the data, and convert the non-numeric data into integers with the to-matrix function.
(def math-prog (to-matrix (get-dataset :math-prog)))And then extract the math and programming results.
(def math (sel math-prog :cols 1))
(def prog (sel math-prog :cols 2))
And run the chisq-test function.
(def math-prog-test (chisq-test :x math :y prog))(:X-sq math-prog-test) ;; 1.24
(:df math-prog-test) ;; 1
(:p-value math-prog-test) ;; 0.265 In this case, we can’t reject null hypothesis, there is no association between the high school math proficiency exam and pass/fail rate of the freshman programming course.
The complete code for this example can be found here.
Further reading:
Chi-square testing at Wikipedia
Yates’ continuity correction at Wikipedia

thats perfect and understadable